Key Performances

Building the sustainable tomorrow
Sustainable development and corporate social responsibility are fulfilled through the establishment of a safety, environment and health management system.
Safety
Direct Employees
| 2021 | 2022 | 2023 | 2024 | |
|---|---|---|---|---|
| Number of Serious Accidents | - | - | - | - |
| Industrial Accident Rate (Number of Victims/ Number of Workers) *100 | 0.00% | 0.11% | 0.00% | 0.00% |
| LTIR (Lost Time Injury Rate) Number of lost labor / Total hours worked *1,000,000 | 0.00 | 0.54 | 0.43 | 0.00 |
| OIFR (Occupational Illness Frequency Rate) Number of occupational diseases / total hours worked *1,000,000 | 0.00 | 0.00 | 0.00 | 0.00 |
Contractors
| 2021 | 2022 | 2023 | 2024 | |
|---|---|---|---|---|
| Number of Serious Accidents | - | - | 1 | - |
| Industrial Accident Rate (Number of Victims/ Number of Workers) *100 | 2.63% | 0.00% | 1.49% | 3.68% |
| LTIR (Lost Time Injury Rate) Number of lost labor / Total hours worked *1,000,000 | 12.37 | 0.00 | 7.04 | 16.53 |
| OIFR (Occupational Illness Frequency Rate) Number of occupational diseases / total hours worked *1,000,000 | 0.00 | 0.00 | 0.46 | 0.90 |
Climate change response
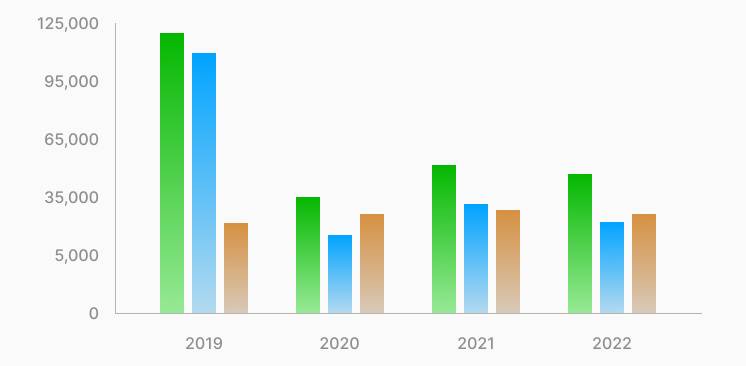
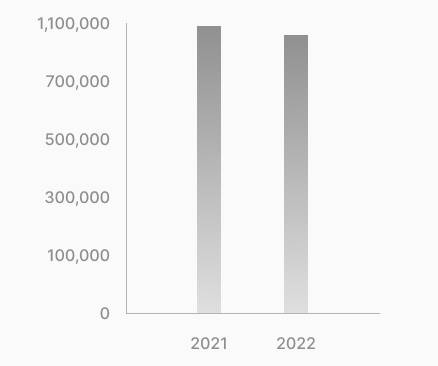
Greenhouse gas emissions performance
Scope 1+2 (Total direct and indirect emissions)

- Scope 1+2 Total emissions1 1
- Direct emissions(Scope 1)
- Indirect emissions(Scope 2)
Scope 3 (Total other indirect emissions)

- Scope 3 Total emissions 2
Unit : tCO2-eq
- Scope 1 and 2 emissions are based on the Ministry of Environment’s emission certificate or review statement for objection (reference emission for the base year when allocating the 4th planning period)
- Based on DNV Business Assurance Korea verification statement (06.23.23)
- 8. Upstream Lease Assets, 10. Processing of Products Sold, 14. Franchise (Reason: Not Applicable)
- Excluded in the sum of total global sector emissions : 15. Investment (Reason: cannot be classified as global sectors as it is Hanwha emissions)
Energy Consumption
| 2021 | 2022 | 2023 | 2024 | |
|---|---|---|---|---|
| Direct Energy Consumption | 172 | 169 | 166 | 142 |
| Indirect Energy Consumption | 421 | 416 | 529 | 620 |
| Total Consumption | 592 | 585 | 696 | 762 |
Unit : TJ
- Scope 1 and 2 emissions are based on the Ministry of Environment’s emission certificate or review statement for objection (reference emission for the base year when allocating the 4th planning period)
Environment
Air Pollutants
| 2021 | 2022 | 2023 | 2024 | |
|---|---|---|---|---|
| NOx emissions | 5.04 | 8.44 | 13.95 | 15.91 |
| SOx emissions | 0.01 | 0.00 | 0.47 | 0.18 |
| Dust emissions | 1.62 | 1.26 | 4.41 | 3.81 |
Unit : Ton
Water Pollutants
| 2021 | 2022 | 2023 | 2024 | |
|---|---|---|---|---|
| TOC emissions | 0.46 | 0.10 | 0.13 | 0.61 |
| BOD emissions | 0.44 | 0.50 | 0.04 | 0.02 |
| SS emissions | 0.77 | 1.19 | 0.12 | 0.34 |
Unit : Ton
Waste (General/Designated)
| 2021 | 2022 | 2023 | 2024 | |
|---|---|---|---|---|
| Incineration | 216 | 154 | 222 | 250 |
| Landfill | 38 | 47 | 27 | 98 |
| Recycle | 770 | 533 | 346 | 795 |
| Etc. | 2 | 0 | 0 | 0 |
| Total emissions | 936 | 734 | 595 | 1,143 |
Unit : Ton
Water
| 2021 | 2022 | 2023 | 2024 | |
|---|---|---|---|---|
| Groundwater | 168,891 | 193,931 | 170,563 | 248,050 |
| Third-Party Water Resources | 476,549 | 517,282 | 541,275 | 834,165 |
| Total Usage | 645,440 | 711,213 | 711,838 | 1,082,215 |
Unit : Ton